


Introducing Nexus OD: Turning Mobility Data into Action
.png)
Expanding the Power of Nexus
Flow Labs has always been driven by a simple mission: to help transportation professionals see mobility more clearly, so they can design safer, smarter, and more efficient transportation systems. With the launch of Nexus OD, we are taking a major step forward in that mission.
This new product in our Mobility Management solution suite, harnesses connected vehicle data at scale and places it into the hands of agencies and planners in a way that is both powerful and intuitive. Where trips begin, where they end, what routes they take, and how they flow across a region are some of the most fundamental insights in transportation. Yet historically, they have been the hardest to capture. Surveys are costly and outdated, while custom analyses often require months of preparation. Nexus OD changes that. With just a few clicks, users can generate a complete picture of travel patterns in a matter of minutes.
A Unified Platform for Shared Understanding
One of the most powerful aspects of Nexus OD is how it integrates seamlessly into the Flow platform alongside our other market-leading products. Transportation agencies can now bring all of their favorite tools together into a single environment, accessible under one login. This unified approach ensures that multiple teams—planners, modelers, engineers, and policy makers—can work from the exact same data and analyses.
Instead of juggling disconnected platforms, exporting files, or reconciling conflicting results, everyone sees the same flows, maps, and reports. That shared foundation allows teams to move faster, reduces friction in collaboration, and gives decision-makers confidence that insights are consistent and reliable.
A Beautiful, User-Centric Interface
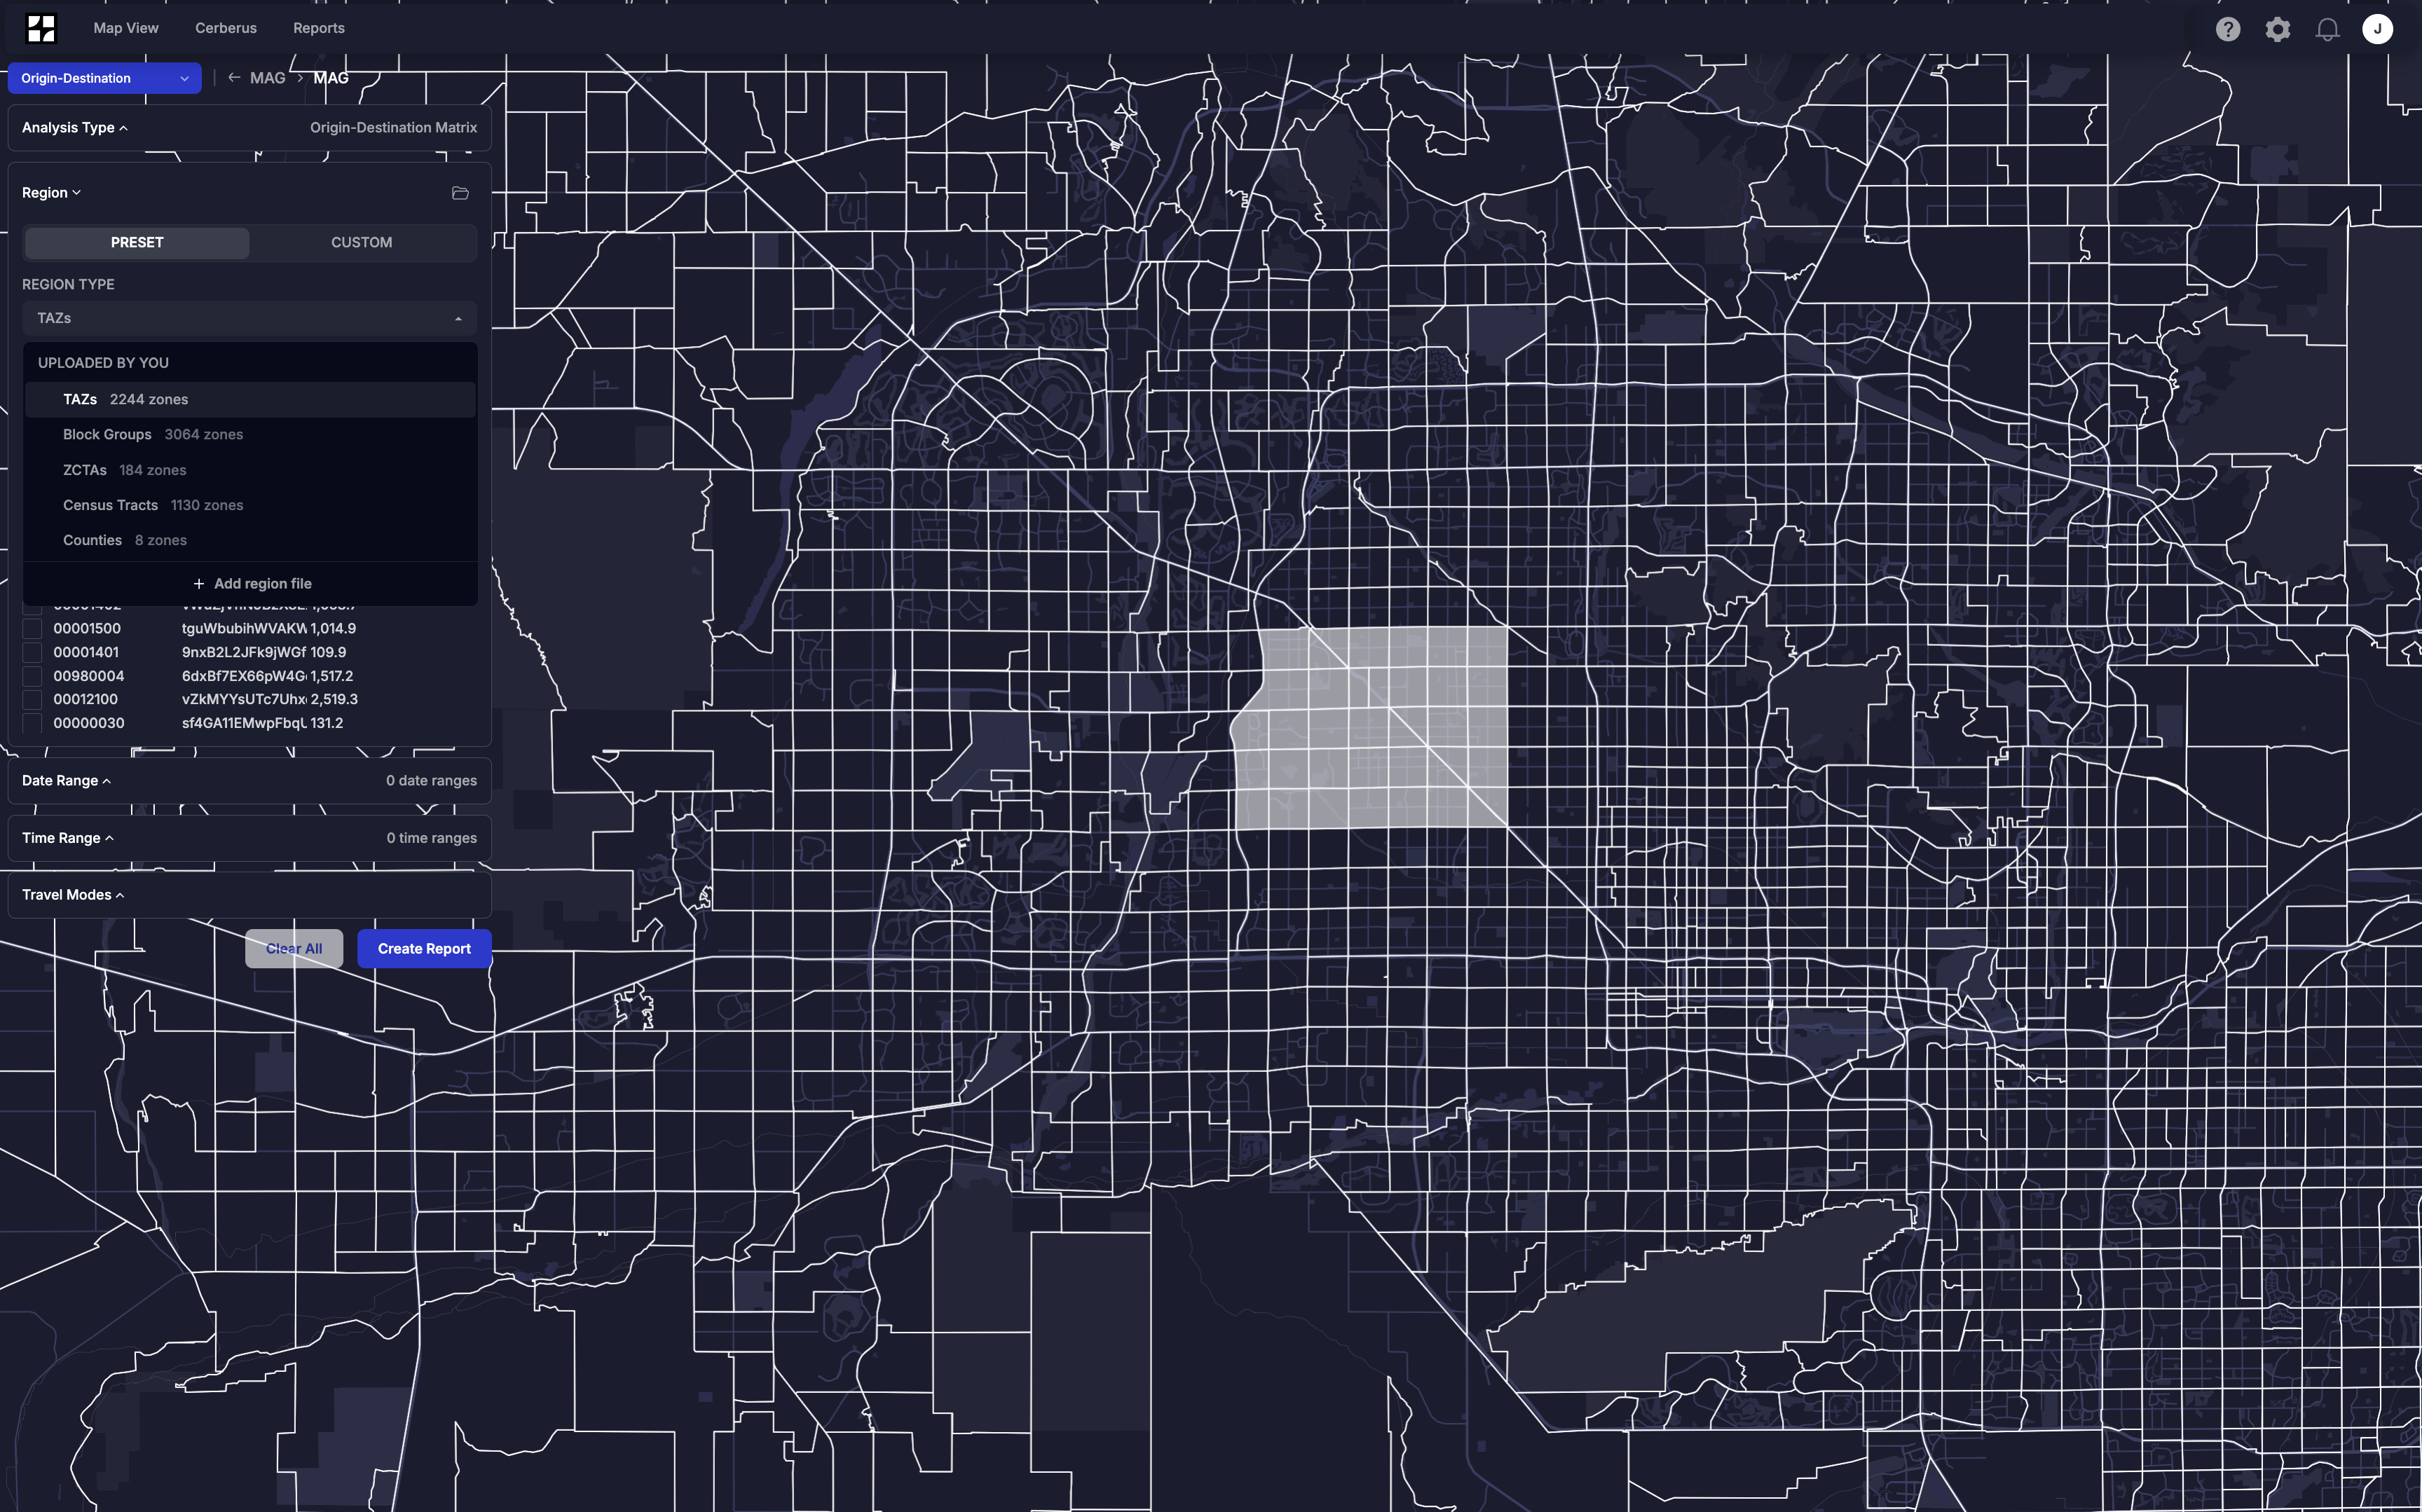
Powerful data is only as useful as the way it is presented. That’s why Nexus OD was built around a user-first interface that makes complex analyses both accessible and engaging. From the moment a user selects “Origin-Destination” in Nexus, they are guided through a streamlined workflow that simplifies every step of the process.
The configuration sidebar makes it easy to define regions, select timeframes, and choose modes of travel. Reports can be generated with just a few clicks, saved for future reference, and revisited at any time. Once complete, analyses are brought to life through clear and visually compelling outputs. Users can explore interactive maps that highlight travel flows, examine origin-destination matrices in detail, and dive into histograms of trip lengths and durations.
The design is not just about functionality—it is about clarity and storytelling. Every visualization is crafted to make mobility patterns immediately understandable, whether the audience is a technical analyst or a community stakeholder. By pairing data accuracy with a beautiful, intuitive interface, the OD module ensures that insights don’t stay hidden in spreadsheets—they become tools for communication, collaboration, and action.

Flexible Analyses Built Around Agency Needs
Every region has its own planning context, and every agency has its own way of defining boundaries, corridors, and routes of interest. Nexus OD was designed with flexibility at its core, so it can adapt to those diverse needs.
For regional and macro-level planning, the module supports zone-based analysis, allowing agencies to work with zip codes, census tracts, traffic analysis zones, or custom geographies. For corridor-focused work, link-based analysis provides clarity on how trips enter and exit specific roadways, and how volumes shift under congestion or diversion scenarios. And for detailed travel paths, route-based analysis enables precise evaluation of commuter routes, transit alignments, and diversion paths.
This flexibility also extends to data inputs. Agencies can combine their own datasets with TomTom’s OD data, ensuring analyses remain grounded in the contexts that matter most locally. At the same time, Flow Labs makes it easy to bring in additional datasets from our data partners. Bicycle trips, pedestrian flows, or commercial vehicle insights from Geotab can all be layered in to provide a richer, multi-modal picture of how people and goods move through a network. By unifying these perspectives, Nexus OD delivers a holistic understanding of mobility that few tools can match.
Grounded in Real Volumes
Flexibility matters, but accuracy matters even more. That’s why Nexus OD is tightly calibrated to real-world traffic volumes using Flow Labs' market-leading volume estimation technology. Flow Labs’ models draw on detection systems, traffic counts, and other observational data across regions, ensuring that the flows shown in Nexus OD are not abstract estimates, but demand patterns weighted by actual vehicle counts.
This grounding is critical for agencies that need to translate analysis into action. Whether planning a corridor upgrade, evaluating a diversion plan, or calibrating a regional model, users can trust that the volumes behind each origin-destination pair reflect real-world demand. It is the difference between guessing at travel behavior and making decisions with confidence.

From Data to Insights That Drive Action
Nexus OD doesn’t just deliver numbers. It translates data into clear, actionable visuals that make mobility trends easier to understand and share. Interactive maps show where trips begin and end. Matrices provide structured insights into flows between regions. Histograms capture distributions of trip durations, lengths, and speeds.
These outputs are designed for both discovery and communication. A planner can use them to test scenarios, a modeler can use them to validate assumptions, and a policy team can use them to build consensus with stakeholders. The result is a shared language of mobility that bridges technical detail and strategic decision-making.

Real-World Applications
Imagine a city preparing a corridor improvement project. With Nexus OD, the planning team can use link-based analysis to evaluate traffic entering and leaving the corridor, zone-based analysis to understand the larger regional context, and route-based analysis to test potential diversions. Each layer of insight connects back to real volumes, helping the agency design solutions that reflect how people actually move.
Or consider a regional planning agency comparing commuting patterns across neighborhoods. By combining agency-specific boundaries with TomTom’s OD data, and layering in bicycle or pedestrian flows, the agency can develop a nuanced understanding of how residents access jobs, services, and transit. Commercial vehicle data from Geotab can further enhance this picture, showing how freight and logistics intersect with passenger travel. In every case, Nexus OD provides clarity that is grounded, multi-modal, and immediately useful.
Looking Ahead
This latest release of nexus OD is just the starting point. We are actively building a number of exciting new developments for our origin-destination customers, from expanded datasets to enhanced visualizations and faster analysis capabilities. Each of these will further strengthen the ability of agencies to see mobility more clearly and act with greater confidence.
If you want to explore how Nexus OD can benefit your organization, we encourage you to contact our sales team. This is your opportunity to see how a unified, flexible, and beautifully designed tool can transform the way you understand and manage mobility.
Manage every traffic management system and data in one platform, without the need for new hardware.
.avif)

