


We watched the World Cup test Atlanta's traffic network — in real time
The World Cup has brought Mercedes-Benz Stadium its first three matches of the summer, with more to come. Using connected-vehicle data, we tracked what each one did to the streets around it — against a normal weekday, and against the biggest events the city had planned around before.
A packed stadium is one of the hardest things a city's traffic signals ever have to handle. Seventy-five thousand people arrive in a few hours, sit for two, and try to leave at once — all through the same dozen intersections. For the agencies that run those signals, the hard part has never been knowing that traffic gets bad. It's seeing where, when, and how bad with enough resolution to actually do something about it.
We didn't add a single camera or send anyone out to count cars. The numbers here come from connected-vehicle probe data — anonymized GPS traces from a large sample of the vehicles on the road, turned into the metrics a traffic engineer would recognise (control delay, arrivals on green, split failures, volume-to-capacity) for every intersection, updated minute by minute.
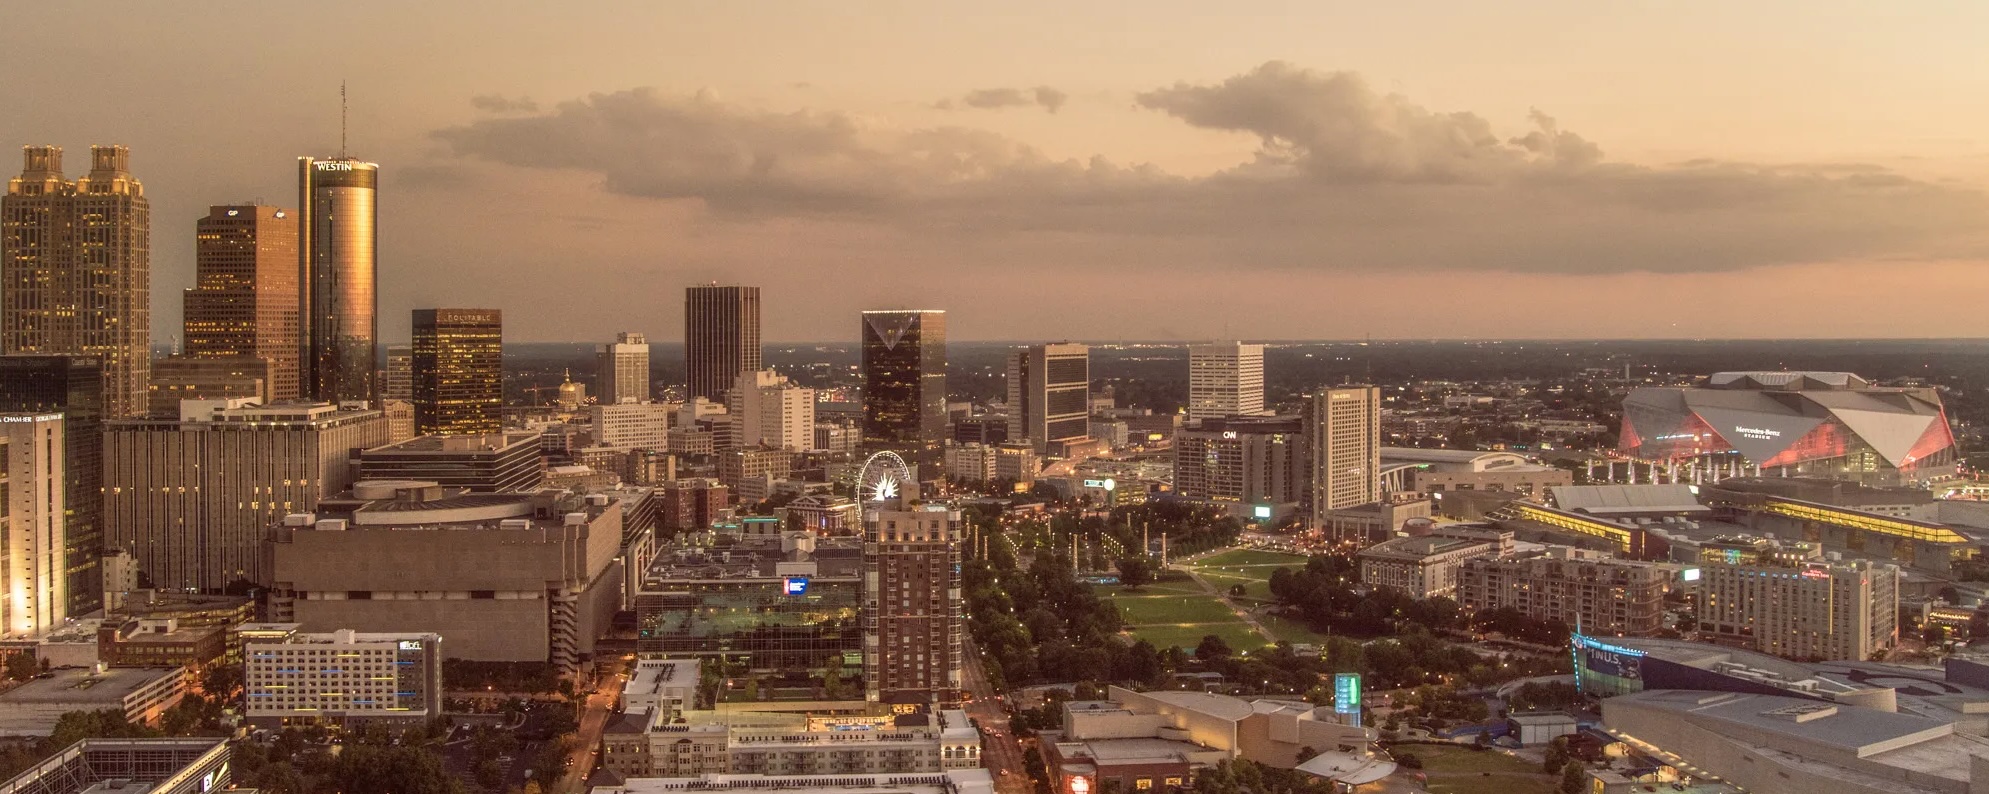
The North Grid is the dense downtown network just north of the stadium, around Centennial Olympic Park, the convention center, and State Farm Arena. Of the 54 signal networks around the Benz, it was the hardest hit. Here's what the first three matches did to it.
The North Grid's 56 signals sit just north of Mercedes-Benz Stadium. Fans pouring out of the stadium move straight into them, which is why this network — not the one ringing the stadium itself — takes the brunt of a match.
The day, as the network felt it
The opener kicked off at noon on a Monday. You can read the match in the delay alone, without being told the schedule — the shape gives away kickoff and final whistle on its own.
The dashed line is a normal weekday; the solid red line is opening day. Delay tracks normal through the morning, then the noon kickoff pushes it past 70s as fans pour in. It holds there during the match — drivers are parked, not driving — then egress hits: delay spikes to 161s per vehicle at 2:30pm and stays above 100s for nearly two hours before the grid drains. The evening commute, which is the worst part of a normal day, barely registers by comparison.
The egress peak lasted nearly two hours and was concentrated in a handful of intersections. On a camera-and-call-in workflow you'd hear about it after it cleared; here it's visible as it forms — the difference between an after-action report and adjusting timing while the queue is still building.
Against an ordinary Monday
Against a normal weekday, the opener changed the network's character. Volume rose 55%, delay more than tripled, and progression broke down the way it does once demand outruns capacity. The baseline is the same network and 10am–4pm window, averaged across the twelve weekdays before the tournament.
Each bar is the opener against a normal weekday; the dashed line is that normal (= 100), and bars above it are worse. Arrivals-on-green is the exception (lower is worse): it fell from 41% to 27%, meaning nearly three in four vehicles now hit a red. When progression breaks, everything downstream of it inflates: queues nearly doubled, split failures jumped from 1-in-10 stops to 1-in-6.
Inside the North Grid, a handful of intersections carried most of the damage. Baker St @ Pemberton Place, the crossing right at Centennial Olympic Park and the World of Coca-Cola, went from about 13 seconds of delay on a normal day to 205 seconds on match day. Centennial Olympic Park Dr @ Walton St went 21s → 188s, and Andrew Young Intl Blvd @ Williams St 37s → 169s. A network-wide average buries intersections like these, and they're exactly where shifting a little green time does the most good.
Volume went up by half. Delay more than tripled. That gap is why you manage signals actively instead of just watching them.
The impact zone
North Grid was hit hardest, but the surge didn't stop at its edges. The map below colours every one of the 325 signals around the stadium by how much delay it gained on opening day, mapping out the event's impact zone. For anyone who drives downtown, it answers a practical question: how close to the Benz did you have to be for a match to wreck your trip?
Each dot is one signal, coloured by added control delay on June 15 (teal = no change, red = +120s or more). The damage falls off sharply with distance: the closest signals lost ~48s each, and by a mile and a half out the effect is essentially gone. The reddest cluster — the worst-hit intersections in the entire deployment — sits inside the North Grid, just north of the stadium. Pan and hover for per-signal numbers.
For anyone driving through downtown that day, the gradient is the whole story. Within three-quarters of a mile of the stadium, almost every signal added roughly 40 seconds or more — the difference between a normal trip and a crawl. From there it drops off fast: about 16 seconds of added delay in the next quarter-mile, under 6 seconds past a mile, and essentially nothing beyond a mile and a half. So the practical radius was tight: a real problem within about three-quarters of a mile of the Benz, and barely noticeable past it. For the people timing those signals, that same gradient shows where the few minutes of green time they can move will actually count.
The impact zone is steep near the stadium and gone by a mile and a half. The job is knowing which signals sit on the steep part.
Against the city's previous big nights
Before the World Cup, the city's worst-case downtown event was the 2025 College Football Playoff National Championship — a sold-out house and a single dominant surge. We measured it the same way, on the same network, so the two can be compared directly.
A noon match and a night championship can't be judged on raw delay, so each is measured against its own normal — the championship against weekday evenings, the matches against weekday middays.
The CFP National Championship, the prior worst case, lifted delay to just 1.3× its evening normal. The World Cup opener hit 3.4×, and on more traffic: it pushed 1.55× a normal day's volume onto the grid versus the championship's 1.32×. A noon kickoff is the harder problem — fans arrive and leave in the middle of an already-busy day, with no quiet evening to absorb the surge.
That reshapes the planning math. Treating the opener "like the championship" would have under-prepared for it on both counts. With every event measured on one scale, the next one is planned against the most comparable day on record, not a guess.
One match against the next
The opener (Jun 15) and the third match (Jun 18, Czechia v. South Africa) drew nearly identical traffic — about 128,000–134,000 vehicles per hour through the network, within 4% of each other. Same network, same window, essentially the same load. The outcomes weren't the same.
With nearly the same number of cars, control delay fell from 80s to 58s, arrivals-on-green recovered from 27% to 34%, and the network health score climbed off the floor. The Sunday Spain match (Jun 21) landed at 56s on lighter volume. The opener was the network's worst day — and it didn't repeat.
Crowd composition, parking, and weather all move these numbers, so three matches isn't proof of a trend. But the shape is encouraging: the worst day was the first one, and at nearly identical demand the network ran measurably better afterward — the pattern you'd expect when operators can watch these same metrics and adjust between events instead of after the season.
Why this is possible now
None of this required instrumenting the network for the tournament. The input is connected-vehicle probe data: anonymized GPS traces from a large sample of the vehicles on the road. From those traces, every intersection gets the same standard traffic-engineering measures it would from dedicated field sensors, kept current in real time.
What "real-time" buys you. The same measurement runs every day across all 325 signals around the stadium. Because every day is computed the same way, any day can be compared to any other — a match against a Monday, a match against last year's championship, match three against match one — with no special study. It's a monitor that's always on, not a report you commission.
Traffic doesn't scale gently. Half again as much volume tripled the delay, and most of it landed on a few intersections inside a two-hour window. When the damage is that concentrated, shifting a little green time to the right intersection at the right moment can do a lot — but only if you can see the queue forming, not read about it an hour later.
There are five more matches to come at the Benz this summer, including a semifinal. We'll be watching all of them the same way — and we'll publish what the data says when it's in.
This analysis was created using FlowMCP. To find out more about how you can manage your traffic signals in real-time using the Flow Platform, contact our team.
Manage every traffic management system and data in one platform, without the need for new hardware.
.avif)

